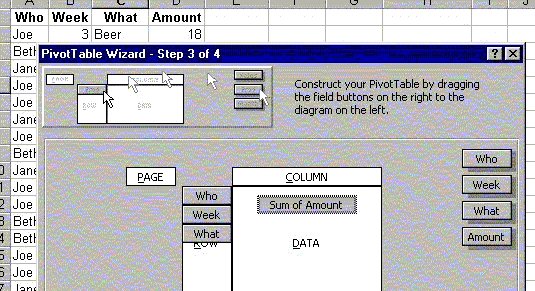
So, what the hell is a Pivot Table in Excel?
Although I've written on Microsoft Excel tips earlier, I've always wondered what the hell a Pivot Table actually was.
It's a question I've been battling for ages. I'd start reading the help pages and soon fall asleep. So, today when I came across a Slashdot review of a book called "A Complete Guide to Pivot Tables", my curiosity was piqued!

Among all the comments in Slashdot, I found this excellent link to the introduction of Pivot Tables. Just copying and pasting the table displayed on the page into Microsoft Excel gave me a basic table to start with. And when I followed the steps, I was amazed to say the least. Quite an eye opener. Give it a shot!
Incidentally, the downloads page has some very useful stuff as well. Also, if you're a keyboard person like me and love shortcuts, you can also get the entire list of Microsoft Excel keyboard shortcuts here.
As an aside, OpenOffice, the free Office suite, also provides similar functionalities. Although the differences, quoting Slashdot, are -
"Granted, this book is specifically written for Microsoft Excel. However, OpenOffice, the free competitor from Sun MicroSystems, mimics most of the Microsoft Office suite. How does it compare, you ask? Well, OpenOffice has a similar facility to Pivot Tables, called DataPilot; however, DataPilot is primitive in comparison. For example, you must select the data to summarize, choose (from the menu bar) Data --> DataPilot --> Start, then drag the fields to the appropriate place in the diagram and click OK. Like Excel, you can freely move the fields between row, column, and data areas, and change the data operation from Sum to Min, Max, or a number of others. Unlike Excel, there isn't much more you can do. You don't have Page fields; you can't sort fields on their data; PivotCharts aren't represented; and there's no programming."


0 Comments:
Post a Comment
<< Home